> ## Documentation Index
> Fetch the complete documentation index at: https://docs.fastgen.com/llms.txt
> Use this file to discover all available pages before exploring further.
# Custom Reporting
Receive a weekly report on key user data and customize to your use case.
#### Time Frequence
The default template will execute every Friday at 5pm. You can adjust the time frequence under `Condition` in the top action block if you prefer daily or monthly updates.
#### Database Query
For our example in the default version we are interested to receive a report on number of sign ups in the past week, best referral source and which country most of the new sign ups are coming from. We will receive results for those questions from the database using a sequence of [DB Query](/actions/native-action/db-query) action blocks.
1. New users last 7 days
```sql theme={null}
SELECT COUNT(*) AS TotalUsers
FROM customers_saas
WHERE system_created_at >= (CURRENT_TIMESTAMP - '7 days'::interval);
```
2. Best referral source
```sql theme={null}
SELECT Source, COUNT(*) AS NumCustomers
FROM customers_saas
WHERE system_created_at >= (CURRENT_TIMESTAMP - '7 days'::interval)
GROUP BY Source
HAVING COUNT(*) = (
SELECT MAX(sub.count)
FROM (
SELECT COUNT(*) AS count
FROM customers_saas
WHERE system_created_at >= (CURRENT_TIMESTAMP - '7 days'::interval)
GROUP BY Source
) AS sub
);
```
3. Most frequent country
```sql theme={null}
SELECT geography, COUNT(*) AS NumCustomers
FROM customers_saas
WHERE system_created_at >= (CURRENT_TIMESTAMP - '7 days'::interval)
GROUP BY geography
HAVING COUNT(*) = (
SELECT MAX(sub.count)
FROM (
SELECT COUNT(*) AS count
FROM customers_saas
WHERE system_created_at >= (CURRENT_TIMESTAMP - '7 days'::interval)
GROUP BY geography
) AS sub
);
```
#### Slack Message
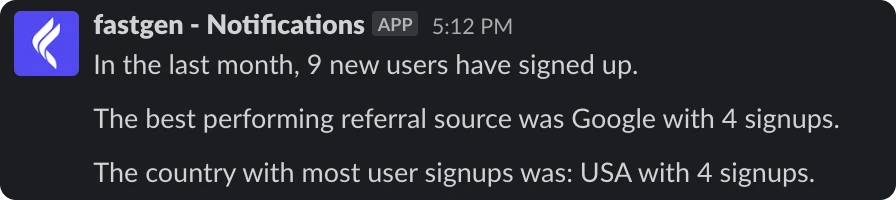
In a last step, we will send the outcomes of all queries in a condensed Slack message. The default version will look like:
> In the last month, `{{steps.new-users-last-7-days.outputs.Result.0.totalusers}}` new users have signed up.
> The best performing referral source was `{{steps.best-referral-source.outputs.Result.[0].source}}` with `{{steps.best-referral-source.outputs.Result.0.numcustomers}}` signups.
> The country with most user signups was: `{{steps.most-frequent-country.outputs.Result.0.geography}}` with `{{steps.most-frequent-country.outputs.Result.0.numcustomers}}` signups.
In action it will look something like this:
#### Modification
You are able to customize all parts of this report. Starting from inserting data in the database (or data source you are checking) to change the statistics you are querying for.
 #### Modification
You are able to customize all parts of this report. Starting from inserting data in the database (or data source you are checking) to change the statistics you are querying for.
#### Modification
You are able to customize all parts of this report. Starting from inserting data in the database (or data source you are checking) to change the statistics you are querying for.